

Setup Prometheus & Grafana in Docker
Note This post is part of the DevOps Journey
There are probably thousands of tutorials on setting up Prometheus & Grafana out there; This is probably the most basic one, with one-liners to get you started.
Prometheus
Prometheus is for gathering metrics and Grafana is for the visualization of the gathered metrics.
prometheus.yml contains the configuration for Prometheus and the targets url’s where the metrics can be collected. Check out the example file. We want this file to be stored outside of Docker, on the host computer and we will bind-mount this file on the host, to the Prometheus Docker container.
To run the container use this command:
docker run \
    -p 9090:9090 \
    -v /path/to/prometheus.yml:/etc/prometheus/prometheus.yml \
    prom/prometheus
Make sure to place the prometheus.yml file in your path and also change the path. Now Prometheus should be running on the port 9090 on your host.
More detailed info can be found here
Grafana
We use Grafana to create beautiful Dashboards to visualize the metrics collected with Prometheus.
Run the Grafana Docker container
Start the Docker container by binding Grafana to external port 3000.
docker run -d --name=grafana -p 3000:3000 grafana/grafana
The default admin user credentials are admin/admin.
Add the Prometheus Data Source
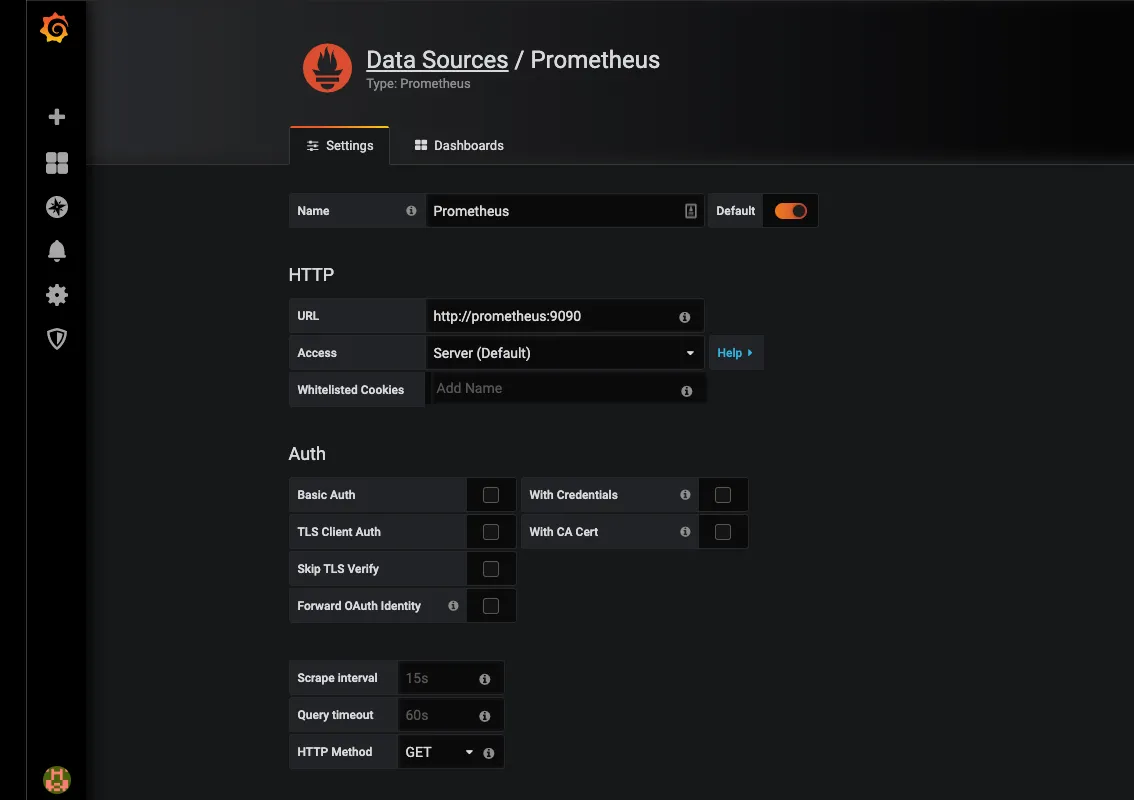
The good thing about Grafana is that there are numerous Dashboards which can be easily imported and used right away.
Leave a comment