
Setup SonarQube Prometheus Exporter
Note This post is part of the DevOps Journey
To monitor SonarQube metrics with Prometheus, we can use the SonarQube Prometheus Exporter plugin or the built-in web API metrics endpoint.
Method 1: SonarQube Prometheus Exporter Plugin
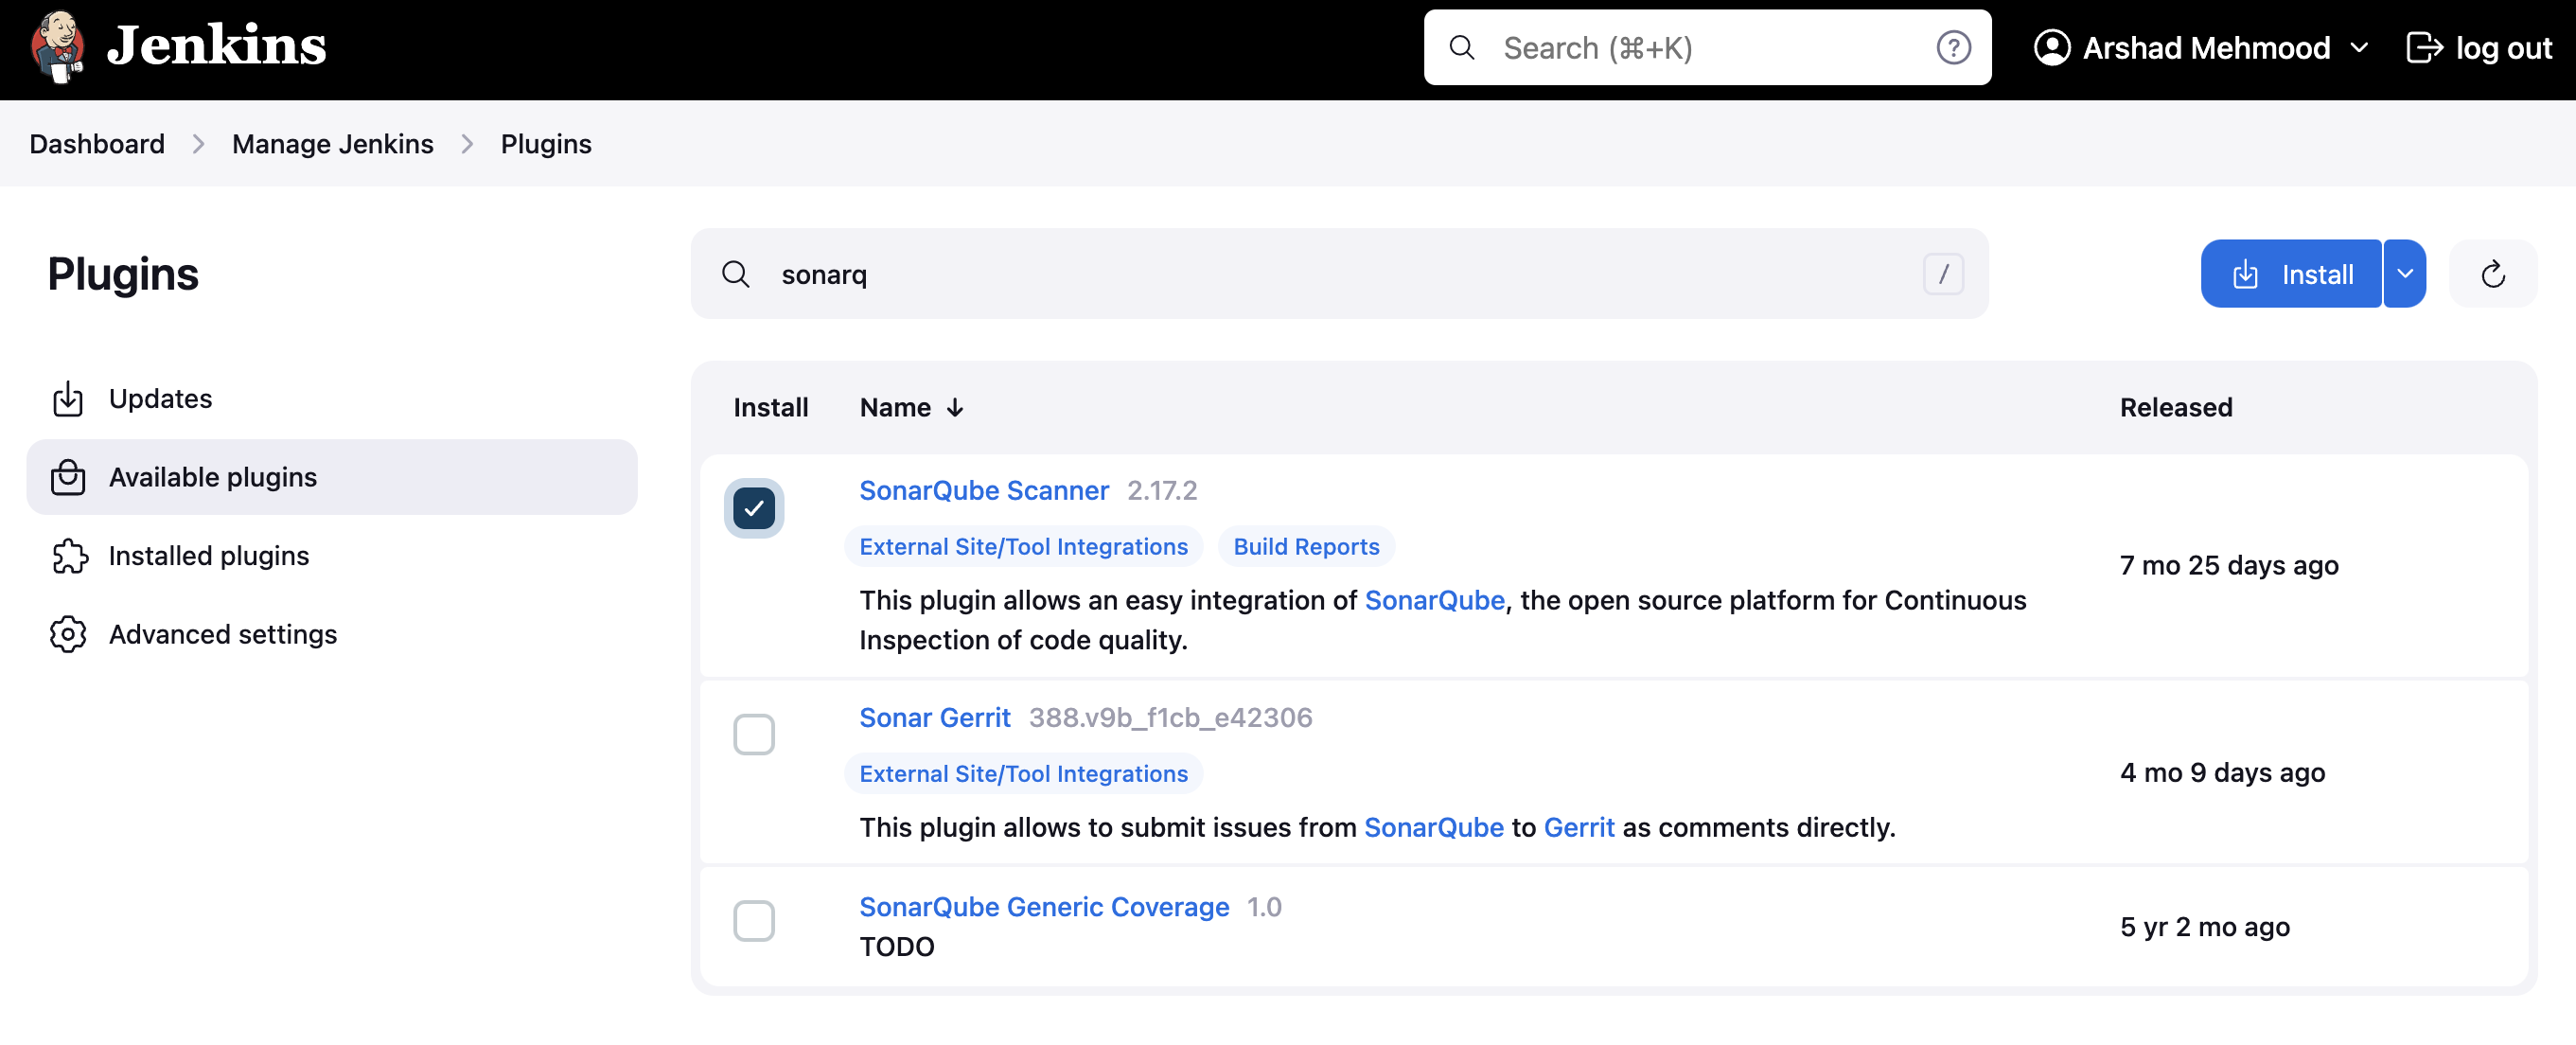
Install the Plugin
- Download the SonarQube Prometheus Exporter plugin from GitHub
- Place the JAR file in
$SONARQUBE_HOME/extensions/plugins/ - Restart SonarQube
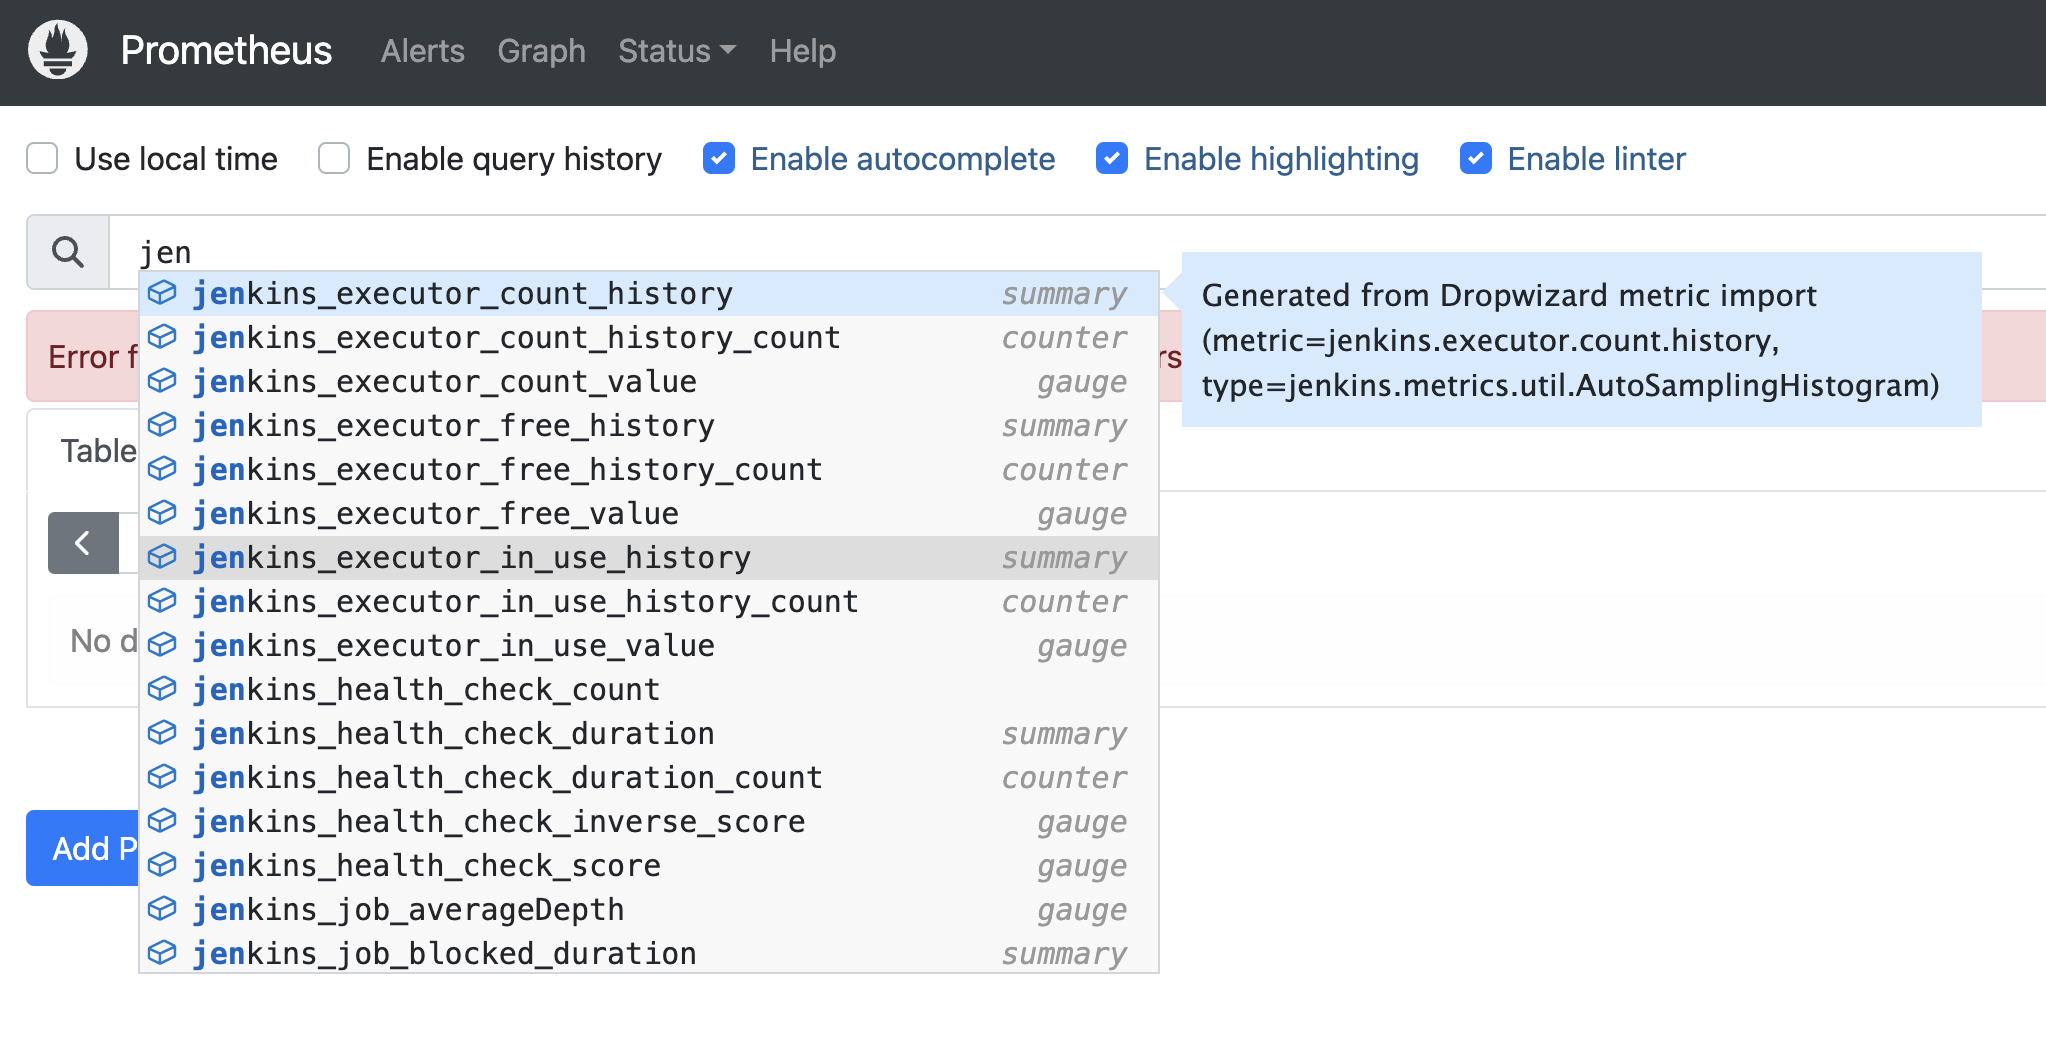
Access Metrics
The plugin exposes metrics at:
http://localhost:9000/api/prometheus/metrics
Method 2: Using SonarQube Web API
SonarQube provides built-in APIs that can be scraped by Prometheus using custom exporters.
Key SonarQube Metrics APIs
- System Health:
/api/system/health - Project Statistics:
/api/measures/component - Quality Gates:
/api/qualitygates/project_status - Issues:
/api/issues/search
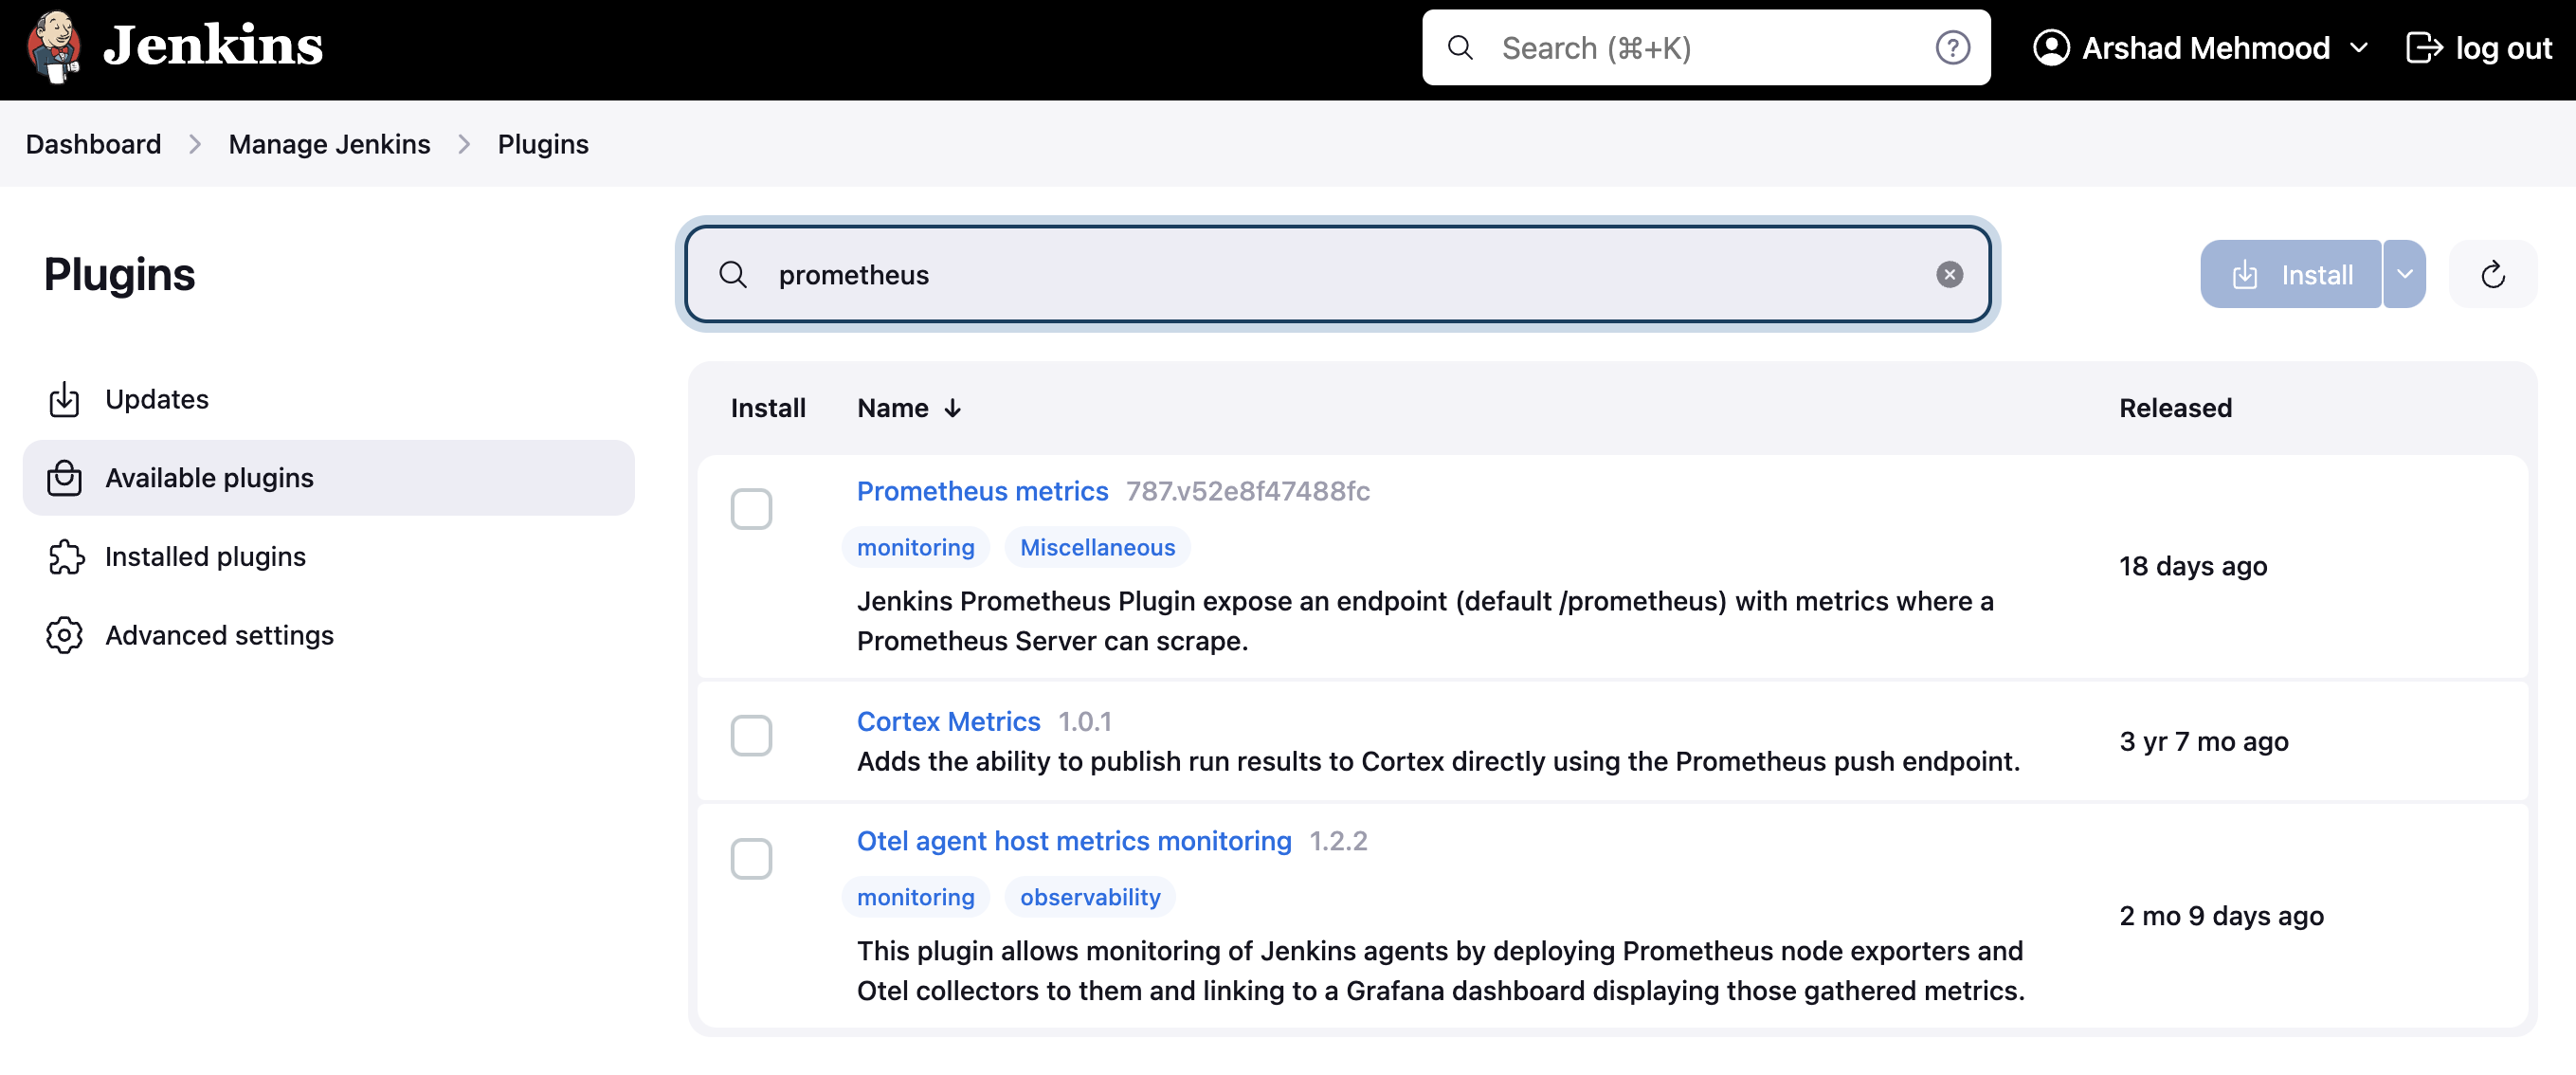
Configure Prometheus to Scrape SonarQube
Add SonarQube to your prometheus.yml:
scrape_configs:
  - job_name: 'sonarqube'
    static_configs:
      - targets: ['localhost:9000']
    metrics_path: '/api/prometheus/metrics'
    scrape_interval: 30s
    basic_auth:
      username: 'your-sonarqube-token'
      password: ''

Custom Exporter Script
If the plugin isn’t available, create a custom Python exporter:
#!/usr/bin/env python3
import requests
import time
from prometheus_client import start_http_server, Gauge

# SonarQube connection
SONARQUBE_URL = "http://localhost:9000"
TOKEN = "your-sonarqube-token"

# Prometheus metrics
lines_of_code = Gauge('sonarqube_lines_of_code', 'Lines of code', ['project'])
bugs = Gauge('sonarqube_bugs', 'Number of bugs', ['project'])
vulnerabilities = Gauge('sonarqube_vulnerabilities', 'Number of vulnerabilities', ['project'])
code_smells = Gauge('sonarqube_code_smells', 'Number of code smells', ['project'])

def collect_metrics():
    # Get projects
    projects_url = f"{SONARQUBE_URL}/api/projects/search"
    response = requests.get(projects_url, auth=(TOKEN, ''))

    for project in response.json()['components']:
        project_key = project['key']

        # Get metrics for each project
        metrics_url = f"{SONARQUBE_URL}/api/measures/component"
        params = {
            'component': project_key,
            'metricKeys': 'ncloc,bugs,vulnerabilities,code_smells'
        }

        metrics_response = requests.get(metrics_url, params=params, auth=(TOKEN, ''))
        measures = metrics_response.json()['component']['measures']

        for measure in measures:
            metric_key = measure['metric']
            value = float(measure['value'])

            if metric_key == 'ncloc':
                lines_of_code.labels(project=project_key).set(value)
            elif metric_key == 'bugs':
                bugs.labels(project=project_key).set(value)
            elif metric_key == 'vulnerabilities':
                vulnerabilities.labels(project=project_key).set(value)
            elif metric_key == 'code_smells':
                code_smells.labels(project=project_key).set(value)

if __name__ == '__main__':
    start_http_server(8000)
    while True:
        collect_metrics()
        time.sleep(60)
Run the Custom Exporter
python3 sonarqube_exporter.py
Update Prometheus Configuration
scrape_configs:
  - job_name: 'sonarqube-custom'
    static_configs:
      - targets: ['localhost:8000']
    scrape_interval: 60s
Key SonarQube Metrics
Monitor these important metrics:
- Lines of Code (
ncloc) - Bugs (
bugs) - Vulnerabilities (
vulnerabilities) - Code Smells (
code_smells) - Coverage (
coverage) - Duplicated Lines (
duplicated_lines_density) - Technical Debt (
sqale_index)
Grafana Dashboard
Create dashboards to visualize:
- Code quality trends over time
- Project comparison matrices
- Quality gate success rates
- Technical debt accumulation
This setup provides comprehensive monitoring of your code quality metrics alongside your infrastructure monitoring.

Leave a comment